Pie Chart Humor SaaS Ad Template - Square
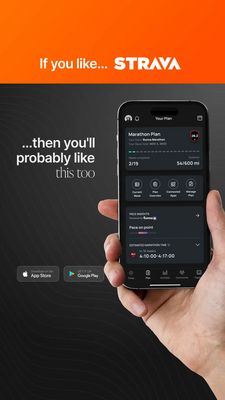
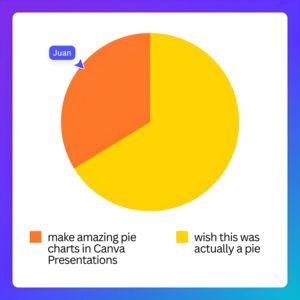
This square ad template promotes a presentation or chart-building SaaS (ideal for Canva-style slide tools) using a playful data-visualization joke to stop the scroll at top-of-funnel awareness. The la...
Free for 7 days — Cancel anytime
About This Template
This square ad template promotes a presentation or chart-building SaaS (ideal for Canva-style slide tools) using a playful data-visualization joke to stop the scroll at top-of-funnel awareness. The layout is clean and modern: a large pie chart dominates the center on a bright white card, framed by a purple-to-teal gradient background. A small chat-style label (“Juan”) points to one slice, adding a light “team collaboration” vibe. At the bottom, two legend blocks with colored squares act as the headline: one option highlights the benefit (“make amazing pie charts in Canva Presentations”) while the other delivers the punchline (“wish this was actually a pie”). This contrast makes the value proposition instantly understandable, even to unaware audiences. The minimal typography and generous spacing keep it looking professional enough for business users, while the humor reduces resistance and boosts recall. Customize by swapping the copy to your feature (dashboards, reports, templates), updating the pie proportions to match your data story, and replacing the name tag with your persona or customer segment.